Merry Christmas and Happy New Year!
December 19, 2018


Usually, it’s a sandwich, occasionally a salad and since I’ve been in Hong Kong it’s a rice box. However, today we’re not going to be discussing my dietary plans.
Once a quarter I’m able to catch up for a lunch with a group of friends and ex-colleagues from across the financial services industry. It’s a private discussion and topics can range from equity volatility, market trends, monetary policy, trading in an Asian restricted market, an election, Brexit, a new product, a hedge fund launch, who is hiring, changing regulations or just what’s interesting in the market.
Around the table this time I’m fortunate to have a deep bench of market practitioners to speak with. This includes a Global Macro Strategist, a CIO for a Family Office, a Hedge Fund Asset Allocator for a Fund of Funds platform, a Financier turned Start-Up CEO, a Regional Sales Trader, a Crypto Hedge Fund Manager, a Journalist and an Equity Derivatives Strategist. We all follow a similar format to reflect on 2018 and offer our thoughts for 2019.
Here are my reflections for 2018:
I was surprised by how surprised the financial markets have been in 2018 with widely telegraphed activity. With a new Fed Chairman and rising real US interest rates for the first time in nearly a decade, we saw the VIX volatility contract move sharply on two specific occasions by more than 200% over a one-week period. More recently this looks to now moving to a possibly higher trading range. With the northbound trajectory in US rates and quantitative tightening, why would the VIX volatility contract remain around the 2017 all-time lows?
My key reflection for 2018 was that how significant level of recency bias is so deeply ingrained within financial market participants and it’s something to watch into 2019 carefully.
Here are my thoughts for 2019:
Market structures are changing, creating opportunities and challenges for asset allocators, investors, risk managers and traders alike.
The significance of risk parity investment structures, the growth of passive investments and electronic market makers have generated new challenges to the market. As these investment mandates have grown they have had an effect on price discovery and liquidity.
The investment structures remove a discretionary bias that exists for an active investment manager. The investment processes that they operate under mean when they have new capital they, by legal mandate, have to make an investment, irrespective of the prevailing market condition. This constant bid has created an asymmetrical bias in terms of liquidity and has yet to be tested and proven when market sentiment, flows and direction change to redemptions and a down ticking market.
Electronic market makers offer a mechanism to provide investor liquidity, however, when most of these businesses are structured to reduce risk if they start to lose money we should expect to see lower levels of liquidity if the market moves outside of its daily trading ranges and increasing gap’s in price discovery. Take a long look at the pricing and liquidity behaviour of the S&P500 mini contract during February and more recently in October to better understand this.
My key thought for 2019 is that we need to better understand flows and liquidity pools. Market participant positioning appears to have risk & trading profile of a short option. This adjusts the behaviour of significant market participants and therefore sources of liquidity. Don’t read me wrong, after twenty years in equity derivatives I’m in favour of financial innovation. Financial engineering has developed solutions to help financial platforms deliver for investors, however, we should take note of when this begins to impact the price discovery process on which these businesses sit.
I hope you have found this thought-provoking and interesting. If you would like to discuss this further with me please contact me at stephen@howard-trading.com as I’d really like to hear your thoughts and opinions.

We are pleased to announce that we have moved our office! We are now located at:
Trade War looming, CNY sliding towards a 7.00 handle, Brexit negotiations stalling, Argentina and Turkey suffering major stress in currency and short end rates markets, IMF proposing a $12bln bail out for Pakistan and the November Mid Term elections coming up, it’s safe to say there is a lot going on.
Our quantitative team thought it would be a great time to take a good look at where market professionals are positioning with the VIX Option contract. Especially interesting this week as we have the Bank Of England, Federal Reserve and Bank of Japan making monetary statements.
The quantitative team developed a Heat Map for the VIX Option Contract market, illustrating Puts and Calls with maturities out to six months and including all option strikes:
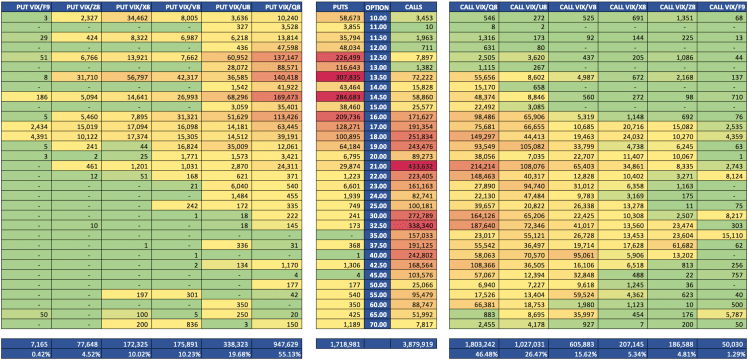
Our Insights:
1) VIX Call-Put Ratio stands at >2.25 which is not significant relative to 2018. Bear in mind that a number greater than 1.00 implies that the market has greater sensitivity to the upside.
2) 55% of Put and 45% of the Call Open Interest have been traded in the one month maturity and only 5% of the open interest is positioning into the year end expiry in December
3) Key Upside Strikes are the 18,19, 21, 22 Strike Call Options, principally in August and September, while the 30 and 32.50 Strike Calls in August have significant positions.
4) Key Downside Strikes are the 12.50, 13.50 & 14.50 Strike Put Options, principally in August.
5) With the 6th November Mid Terms and the November Option Expiry set for the 21st we are seeing only a slight bias towards an uptick in volatility with 207,145 Calls Traded versus 172,325 Puts and strikes of interest being the 13.50 Puts and the 21.00 Calls.
We hope you have found this useful and provides a brief summary snapshot on market positioning, please feel free to reach out if you would like to continue the discussion.

Our CEO, Stephen Howard, attended the MSCI Bell Ringing Ceremony this morning with the President of MSCI. The event marked the historic inclusion of China A-shares at the Hong Kong Stock Exchange (HKEX).
Approximately 230 A-shares will be added to its emerging market benchmark in a move that is seen to connect the China market to the world.
To read more on the MSCI inclusion, you can read this article as featured on NY times: https://www.nytimes.com/reuters/2018/05/31/business/31reuters-china-stocks-msci.html?partner=IFTTT
A big thank you to Raymond Wong & Satyan Patel from the Market Development Team for the invitation!

The 2nd Annual Asia Pacific Buy-Side Summit 2018 was hosted by Thomson Reuters on April 17th, 2018. This year, the summit focused on the topic “Adapting to Disruption”. This event highlighted the impact of disruptive technologies in Asia’s asset management industry which is rapidly changing due to transformational technology.
Howard Trading CEO, Stephen Howard, was part of the panel discussion sharing his insight on Future Trends in Multi Asset Trading. The panel discussed the medium and long term developments in multi asset trading and what traders need to consider to capitalize on them.
Some key points from the panel discussion:
A great event organised by Sanjeev and all the team at Thomson Reuters that brought together professionals from the financial industry to discuss innovative perspectives and ideas.

Federal Reserve Chairman Jerome Powell’s first testimony to Congress was completed earlier this week, the US 10 year Treasury rate is headed to 2.90% we wanted to get ahead of the curve and share some observations on rising interest rate environments.
Our team reviewed the past forty five years of market data and selected all six periods of rising US interest rates, applying the impact across a range of assets:
2004 to 2006
Global asset classes rallied significantly during the period. Copper (+155%), Brent Crude (+98%) and Emerging Markets (+65%) gained significantly while the exceptions were the Japanese Yen (-13%) and the VIX (-28%).
US Equity markets were driven by Energy (+82%), Utility (+39%), Industrials (+26%) and Technology (+9%) being the weakest performer.
1999 to 2000
Global asset classes gained during the period. Brent Crude (+100%), NASDAQ100 (+78%), CAC40 (+53% and the Hang Seng (+48%) reflected the largest gains while the VIX (-16%), Euro (-11%) and British Pound (-6%) declined.
US Equity markets were driven by Technology (+48%), Energy (+23%) while the Consumer Discretionary (-10%) and Materials (-10%) and Financials (-5%) declined.
1993 to 1995
Global asset classes gained during the period with most global equity markets posting ~18% gains. Notably Copper (+85%), NASDAQ100 (+40%) and Japanese Yen (22%) reflected the largest gains and the NIKKEI225 (-28%), US Dollar (-12%), CAC40 (-12%), VIX (-12%) and Brent Crude (-6%).
1988 to 1989
CAC40 (+72%), Emerging Markets (+63%) and the DAX (+47%) were the strongest gainers. While Gold (-23%), Japanese Yen (-17%) and British Pound (-17%) fell most significantly during this period.
1977 to 1981
Our dataset starts to thin at this juncture. All key markets demonstrated a rally during this time period, whether this is the Hang Seng (+295%), Gold (+198%), World Equity Markets (+68%) or the NIKKEI225 (+58%).
1972 to 1974
As the earliest component of our dataset, we reflect gains in Gold (+254%) NIKKEI225 (+70%) and losses in the S&P500 (-16%) and DAX (-16%).
Final Thoughts
The data demonstrates that at different times differing asset classes respond to rising rates with greater or lesser degrees of sensitivity.
While the geopolitical backdrop of the times differs (Oil Embargo’s, Middle Eastern conflict, Black Monday, German Reunification, Technology boom, Chinese reflation) and may provide a significant lever on one or multiple asset classes there are significant underlying themes that present themselves.
Contextually we must now consider how does low-interest rates and quantitative easing change this perspective. Good Hunting.!

As we settle into the new year, take a look at some 2018 forecasts from the sell side companies who share insights on the challenges and opportunities to come this year.
Have a read on some key topics, global economy, and insights from the next generation of investors in Credit Suisse’s 2018 forecast. Click here to read the full forecast.
UBS Asset Management takes an in-depth look into the challenges and opportunities in 2018. Click here to read.
Happy Trading!
We would like to share this informative document from the CFTC on Virtual Currencies.
The document discusses topics such as: What is Virtual Currency, Bitcoins and Related Technologies, Potential Uses, CFTC’s role as well as the different risks associated with these virtual currencies.
To read the full document, click on the link: http://www.cftc.gov/idc/groups/public/documents/file/labcftc_primercurrencies100417.pdf

Our CEO shares his thoughts on Bitcoin’s expansions into the futures market.
He discusses issues concerning CME’s proposed listing of a futures contract and takes a look at some scenarios and outcomes of the futures listing process. He also touches on concerns around how it will play out in today’s environment where regulators are looking at Bitcoin offerings as traditional securities and clamping down on them.
Click here to read the article.
